Hyperspectral Vision Applications
Get first insights how Hyperspectral Vision match the scopes
- Classification and sorting
- Authenticity detection
- Surface inspection
- Thin layer inspection
- Component evaluation
Classification and sorting
Detection and classification was one of the first applications of hyperspectral imaging in stationary use. Applications for plastics, ore/rock or food sorting are particularly well known. NIR and SWIR HSI systems are particularly suitable here, as chemical information is used for classification.
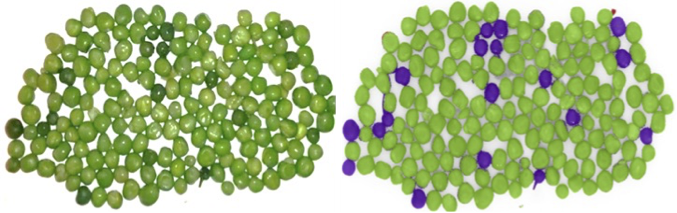
Classification example: solanum in peas
In addition, powder mixtures (e.g. purity, mixing ratios) can also be evaluated, the active ingredient content in tablets can be determined and the condition of impregnated wood (degree of coverage and localization) can be examined. The procedure is very similar to that of classic process analysis. When creating the model, the significant wavelengths are first determined using PCA (particularly high or low loading values on the first main components) and a variable selection is carried out. Based on this variable selection or the entire spectrum, a classification is carried out and the corresponding model is trained according to manually assigned classes (supervised learning). The methods of discriminant analysis (DA) and support vector methods (SVM) are often used. It should be noted that all statistical models have a certain accuracy (quality of model creation or probability that a spectrum is correctly classified) and the predictions made from them have a certain accuracy.
Depending on the sample size, several individual spectra per particle or sample piece can be classified for sorting tasks, thus increasing the accuracy of the classification.
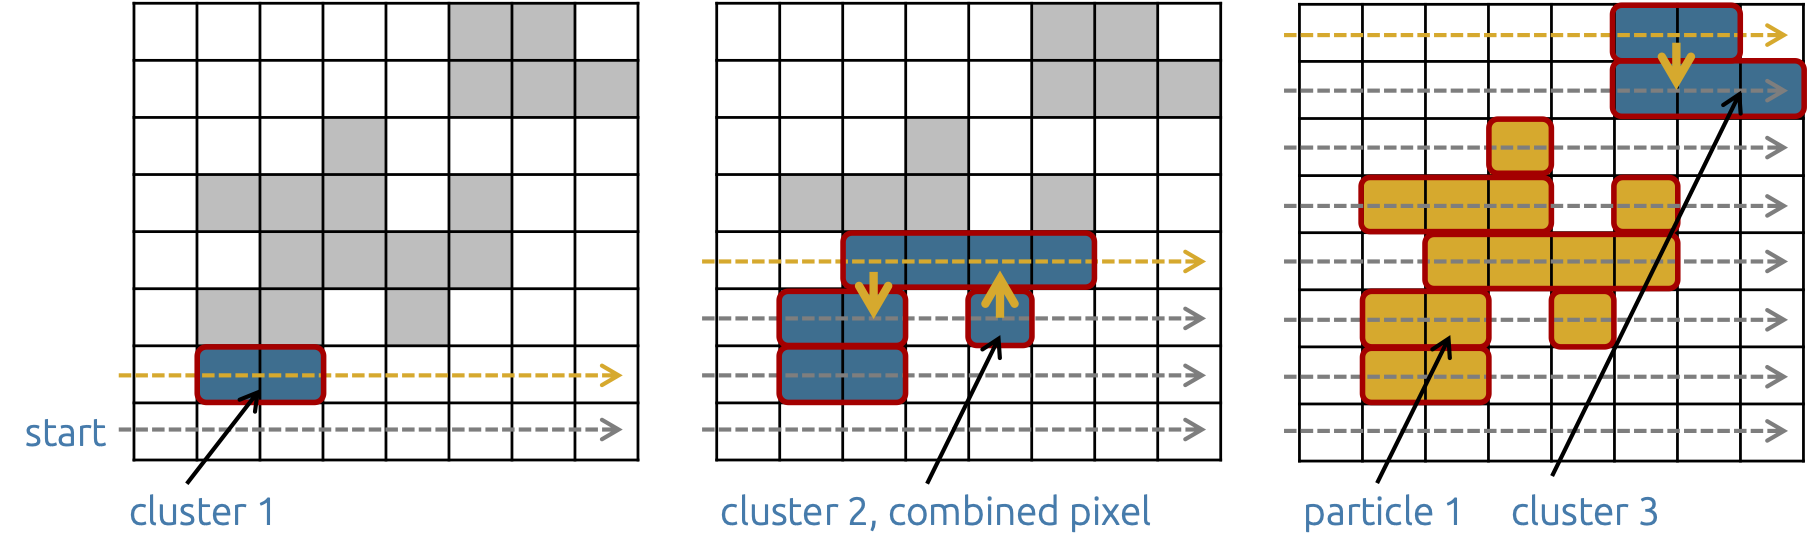
Schematic of particle detection by line-by-line 'scan' of the classification matrix
The model quality and the number of spectra per sample can be used to calculate an overall statistical probability, which is also the quality of the sorting or the quality criterion of the process:
 with P - total probability, p - individual probability (model quality), n - number of spectra per sample, k - number of spectra in a class
Further approaches and possibilities for recognition and improved classification also arise if parameters resulting from the evaluation of the spatial distribution of spectral features are also included in the creation of a classification model.
Authenticity detection
Another application is checking the authenticity of documents. In addition to certified documents and banknotes, historical documents are also of interest here. On the one hand, the data can be used for reconstruction and on the other hand, the spectral signatures can be used to establish correlations between the paper, ink etc. used and thus draw conclusions about the author or the workshop and about authenticity.
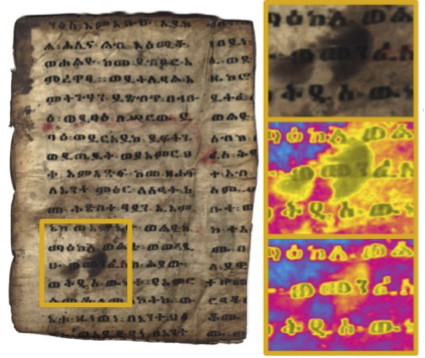
Historical document with heavy soiling, HSI enables the original writing to be made visible (excerpts at 542 nm and 813 nm)
The basis for this is the so-called correlation analysis, in which a PCA is carried out separately for each of the documents examined and the Pearson correlation coefficient is then calculated on the basis of the loading vectors obtained:

with rxy - correlation coefficient, xi,yi - variables (pairs), empirical mean values
For a better overview, the results can be displayed in a correlation matrix or the determined coefficients can be evaluated automatically. From a correlation of ± 0.7, one speaks of a high correlation and thus of a significant connection between the documents examined. Of course, image analysis algorithms can also be included in this application.
Surface inspection
The inspection of surfaces with regard to purity, freedom from defects and homogeneity is one of the most frequent questions for stationary hyperspectral imaging:
- Search for a replacement for the use of a fluorescent dye in the inspection of surfaces
- Automated detection of defects and/or contamination in the surface or an applied coating
- Control of selective removal or application of structures on the surface
- Assessment and prediction of the future behavior of the surface in the further process
For the simplest case, the detection of defects, it is also possible to work without references. The procedure is explained using the example of a coating process (aluminum oxide thin film on stainless steel foil); the VNIR spectral range was used. The spectra are first subjected to smoothing and then converted into absorption spectra. After creating a PCA model, the residual matrix and the T² values of each spectrum are calculated.
 with X - data matrix, T - score matrix, PT - loading matrix, E - residual matrix
 with P - number of principal components, Sp - score value of the principal component, sigmasp - eigenvalue of the principal component
Threshold values for E and T² can then be used to identify outliers from the sample population. The number of detected defects can in turn serve as a quality feature for the coating process.
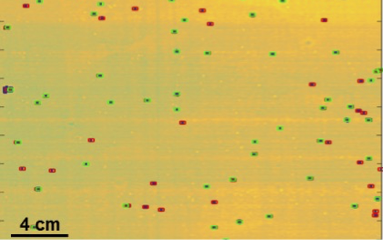
Detected defects in the coating process, red: high T2 values, green: high residual values
In a further application, multi-coated films are selectively structured by ablation in a laser process. In order to observe the depth of the ablation, the spectral angle between the measured spectra and spectra previously recorded on reference samples is calculated.

with alpha - spectral angle, x - measured spectrum, r - reference spectrum
The classification is then carried out according to the largest assumed value of alpha in relation to the reference spectra. Those spectra whose specified deviation from the mean value is too high or which do not reach a previously defined threshold value are also classified as 'defective'.
In another application, the adhesive strength (e.g. according to DIN 65448) of joint samples was predicted non-destructively. Normally, such samples are tested destructively using mechanical tests. However, these tests can only be carried out on a random basis and the test duration is several hundred hours. When testing using HSI, after a principal component analysis, the distribution images of the score values of the first two principal components are used to perform a discrete wavelet analysis (DWT) and evaluate the 'images'. The resulting values can in turn be correlated with the bond strength results using reference samples via a partial least square (PLS) regression model. The PLS model obtained is then used to predict the adhesive strength of unknown samples within a few minutes.
Thin layer inspection
The classical reflection spectroscopic description of thin layers and layer stacks to determine the refractive index n, the absorption coefficient k and the layer thickness d is based on Fresnel's formulas and the determination of the dielectric function (e.g. CAUCHY model) using an optical model describing the sample. Often iterative methods must be used in the calculation to determine the parameters.
The basic prerequisites in Hyperspectral Vision are a defined beam path. For the (hard modeling) calculation, an almost vertical incidence is assumed and starting values from the literature or ellipsometry are used for the iteration.
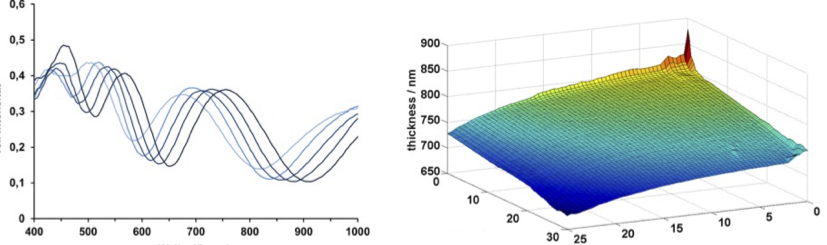
SiO2 layer on silicon, left: Typical interference spectra (measured) and right: calculated layer thickness
Depending on the coating materials and thicknesses, all spectral ranges from UV to NIR are suitable for the investigations. The 'hard modeling' of the coating parameters can take several hours due to the necessary adaptation of each individual spectrum to the model. However, a calibrating 'soft modeling' approach is able to speed up the evaluation and perform the optical layer inspection in real time.
The optical non-contact inspection of sheet resistance with hyperspectral imaging is based on a similar approach. Using the DRUDE model, the specific electrical resistance or specific electrical conductivity can be determined with spatial resolution. Compared to conventional 4-point or eddy current measurements to determine the specific electrical resistance, defects and cracks in the layer can be made visible, but an absolute value cannot be specified due to the principle. The reason for this is that the optical models used at the defects and cracks do not match the real sample. In addition, mapping the calculation errors can provide further indications of inconsistencies and impurities in and on the sample. All transparent conductive layers are suitable for the investigations, as are thin metallic layers.
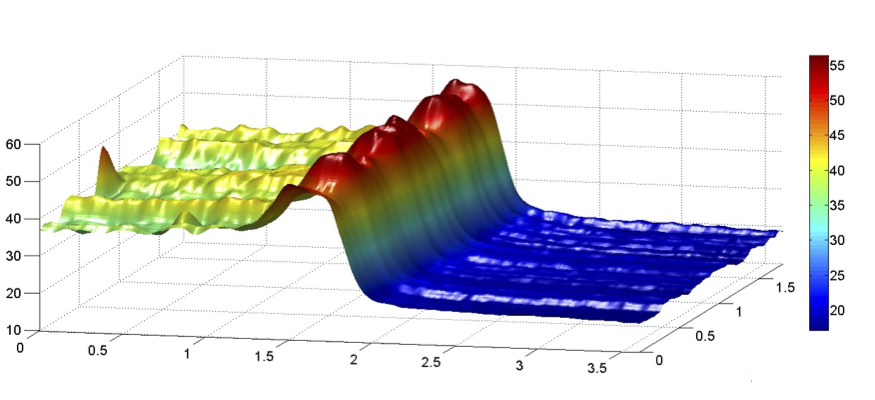
Spatial resolved sheet resistance on a partially flashed indium tin oxide layer, Hyperspectral Vision measurements showed similar results in comparison to eddy current, 4-point-measurements and ellipsometry
Component evaluation
Hyperspectral imaging can also be used in component tests (downstream of the production process). The issues can vary considerably, e.g. OLEDs can be fully spectrally characterized or the printing of microstructures can be monitored. In the case of OLEDs, for example, the active layer can be monitored, while at the same time contacting and other production details are also visible in the HSI. With printed microstructures, the focus is more on the uniformity of the surface. The aim of the inspection must therefore be defined in each case, and the implementation is then carried out using the methods of 'hard modeling' and 'soft modeling' outlined above.
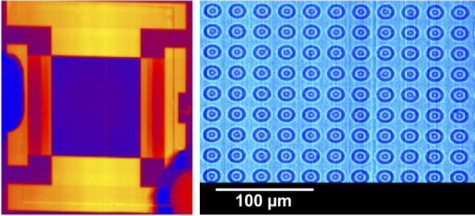
OLED at 1279 nm and printed microstructures at a wvelength of 1397 nm
The following describes an application that goes far beyond this. For the encapsulation of OLEDs in particular, so-called high-barrier films are required that have the lowest possible water vapor transmission rate (WVTR). The WVTR is investigated on high-precision measuring devices using laser diode spectroscopy of water vapor in the ppb range (HiBarSens®), although the measurement times can range from days to several weeks due to the diffusion-based WVTR. WVTR is caused by microscopic defects and inhomogeneity of the high-barrier films. These defects ('pinholes') and irregularities are statistically distributed over the surface and should have a spectral effect. Based on the HSI data of the barrier films and a corresponding multivariate and image-processing calibration, the WVTR can be determined within seconds. The monitoring of the actual product property or the entire barrier film thus becomes inline-capable for the first time.
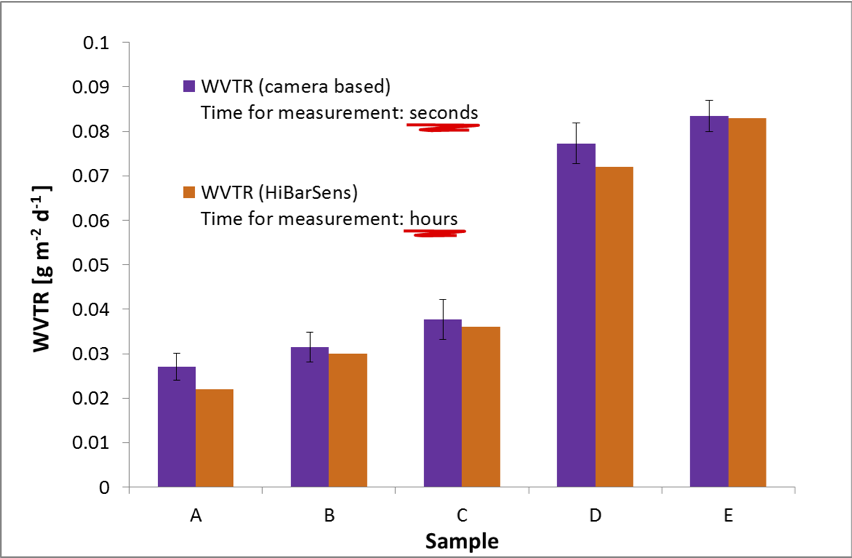
Determination of WVTR rates of HSI against the reference; advantageous are the time constraints for Hyperspectral Vision