2 - Instrumentation
- Optical dispersion
- Measurement arrangements
- Methods in optical spectroscopy
- Process spectroscopy
- Imaging spectroscopy
Optical dispersion
The essential component to obtain the spectrum at all is the 'dispersive element' or the 'dispersive unit'.7 If the dispersive element is additionally coupled with a slit to select a single wavelength, it is also referred to as a monochromator.
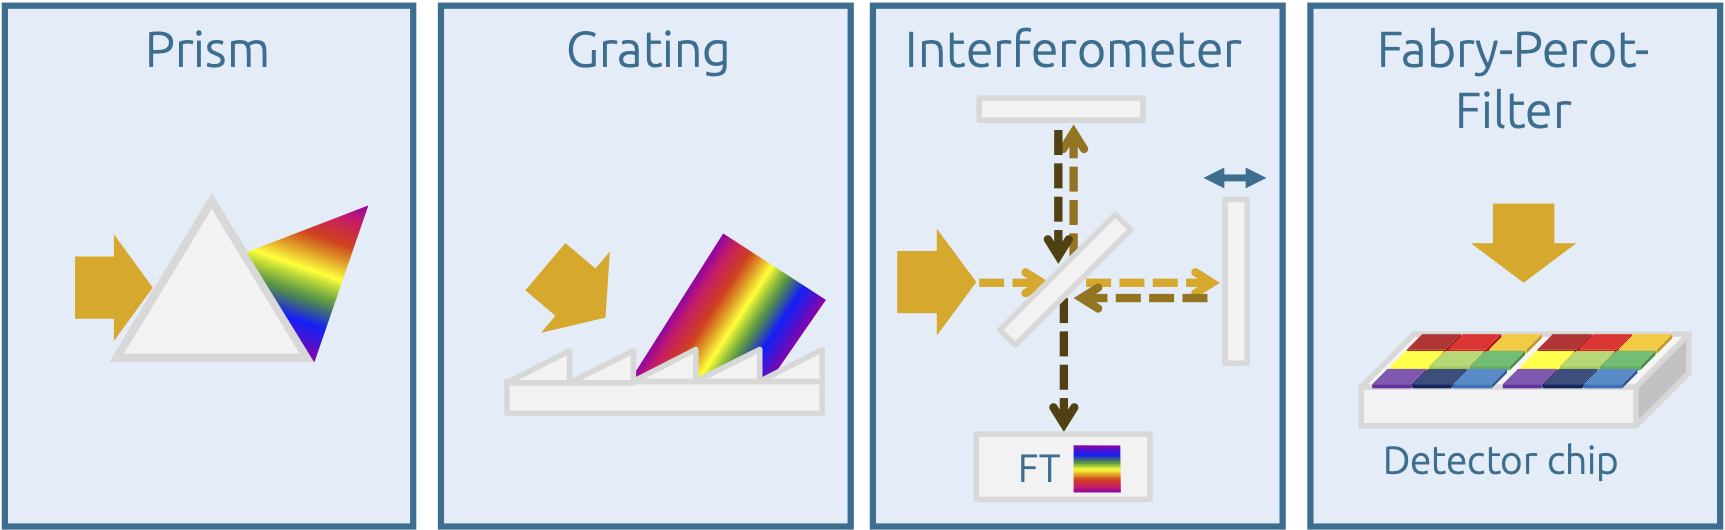
Fundamental arrangement of some dispersive elements
The simplest and most illustrative dispersive element is a prism, but it is now practically irrelevant for spectroscopy. Gratings are most frequently used for dispersion. These can be designed as transmission or reflection gratings. They can be found in practically all UV-VIS and fluorescence devices and also in spectrometers for hyperspectral imaging. The gratings are specific to the desired spectral range and the desired spectral resolution.
Interferometers are used in Fourier transform (FT) spectrometers, the most common type being the Michelson interferometer. The interferometer superimposes the light in a time-dependent manner through a moving mirror, after which the spectrum is calculated by Fourier transformation from the resulting time course of the recorded interferogram. This technique has established itself in IR and RAMAN spectroscopy in particular, as it offers a significant speed advantage.
Fabry-Perot filters, which are applied directly to the detector chip, have become established for multispectral imaging. For each pixel on the detector chip, a 'subpixel' pattern is imprinted from the filters, which are selective for individual wavelengths. However, no continuous spectrum is obtained, as is the case for the other dispersive elements. In most cases, the sub-pixels are arranged symmetrically, from 3x3 to 5x5 wavelengths, so that 9-25 points are obtained from the spectrum as a result.8
The detectors used in optical spectroscopy are often silicon-based in the visible and UV range (high availability, low cost), while radiation detection in the infrared spectral range is performed by semiconductor detectors such as indium gallium arsenide (InGaAs), mercury cadmium telluride (MCT) or pyroelectric detectors such as L-alanine doped triglycine sulphate (DLaTGS). The materials InGaAs and MCT, which are also used for the array detectors of imaging IR spectroscopy, are particularly expensive, limited in size/pixel count and, in the case of MCT detectors, not error-free (the defective pixels are then spectrally interpolated using stored corrections).
The optical beam path, the optics and possible apertures determine the size of the measuring point or the field of view during the measurement. The setup (transmission, reflection, etc.) in which the measurement is carried out can often be freely selected using interchangeable modules. In hyperspectral imaging spectroscopy, the reflection methods are of greater importance, and for measurements in the open field also with the aid of normal daylight or the sun. The optics and the working distance to the sample determine the spatial resolution in particular.
References:
7 from dispersion: lat. 'dispersio' for dispersing, from lat. 'dispergere' for distributing, spreading, scattering: in optics, the speed of propagation of light depending on the frequency
8 A spectrum is called 'multispectral' if there are fewer than 100 points in the spectrum, otherwise it is considered hyperspectral. The points should be as equidistant as possible on the wavelength or wavenumber scale. In reality, however, both terms are often used arbitrarily.
Measurement arrangements
The beam path of optical spectrometers is always based on the same principles. The radiation first passes through a monochromator, then the sample and is then recorded by the detector. Due to the scanning process of the monochromator through the spectral range, measurements with such spectrometers are time-consuming. If, on the other hand, the device has a detector array to detect all wavelengths simultaneously, the entire measurement can be performed instantaneously. In this case, the dispersive element is positioned after the sample.
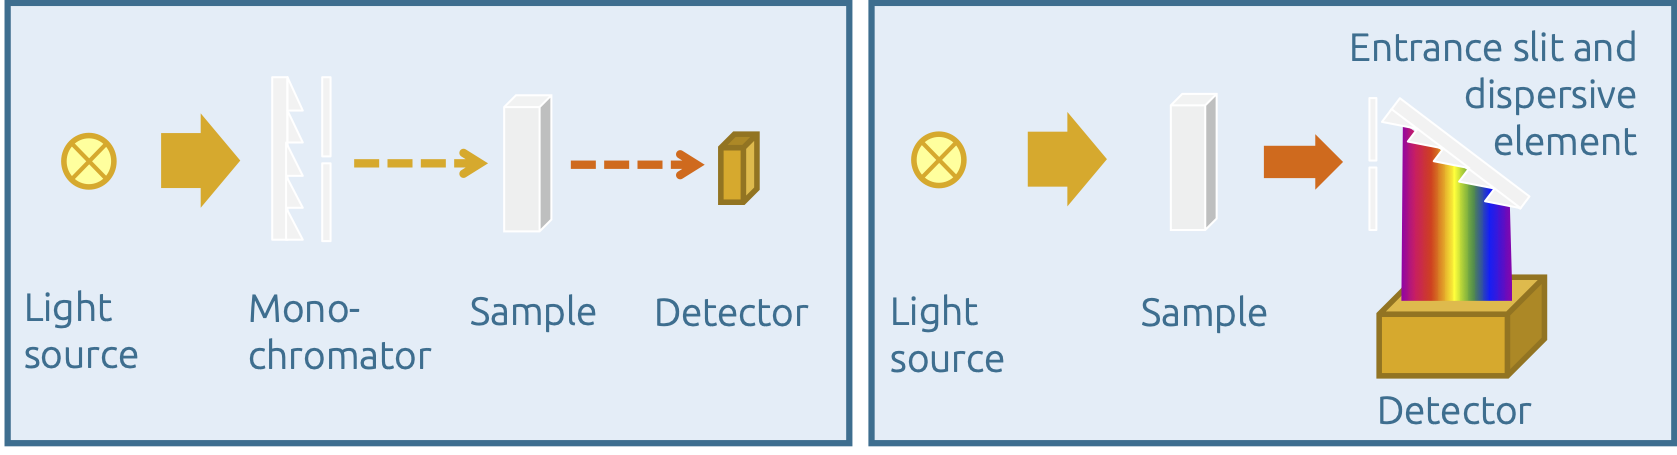
Principal setup of optical spectrometers
All current hyperspectral imaging spectrometers also work according to the last principle presented. Depending on the spectroscopy method, the type and wavelength of the excitation, the sample detection (transmission, reflection, etc.) and the arrangement of the detector in the beam path naturally differ. Additional lenses, optics and filters (polarization filters, grey filters, etc.) can also be placed in the beam path. Microscopes are suitable for realizing the smallest possible examination areas or examination of small structure widths. In addition to the UV/VIS range, such microscopes are also available for the IR range, although they require special optical components such as lenses for the IR spectral range.
Transmission
Transmission measurements are well suited for (semi-)transparent solids such as glasses and films, but also for gases and liquids in particular. With the latter, care must be taken to ensure that the layer thickness is not too great, as otherwise complete absorption can occur and the spectra will be distorted. For a quantitative evaluation, precise knowledge of the path length is also required. Liquid cuvettes are commercially available in large numbers and layer thicknesses. Transmission measurements can also be carried out using microscope optics to resolve smaller structure widths.
Directed and diffuse reflection
Once the sample under investigation is no longer (semi-)transparent, transmission measurements can no longer be carried out. Reflection methods in optical spectroscopy provide a remedy. They can be used in a wide range of applications and sometimes allow very different insights into the samples.
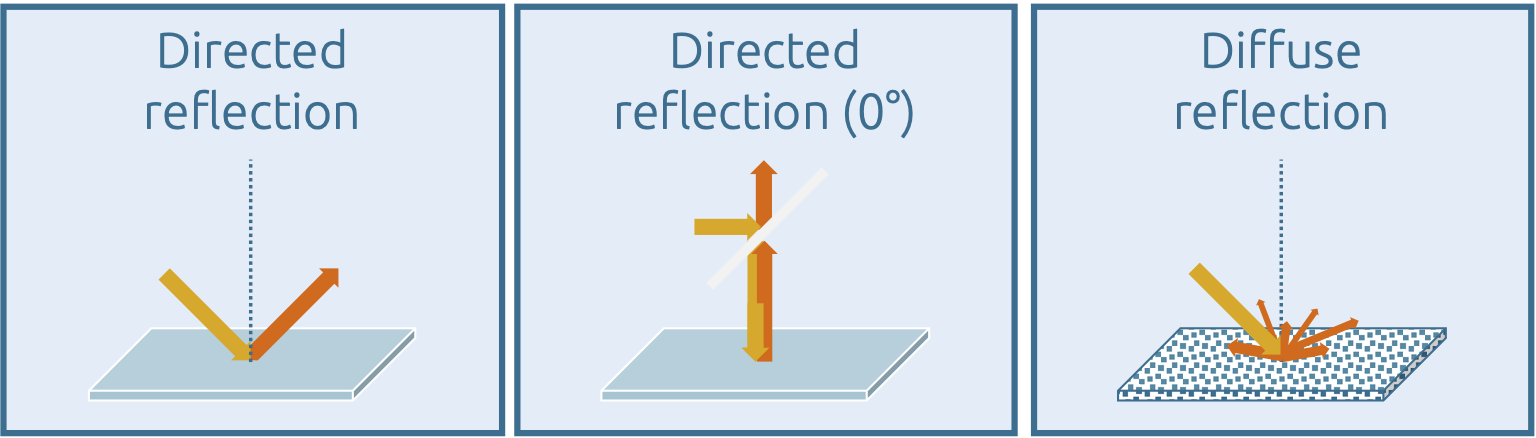
Overview of directed and diffuse reflection
With directional reflection, the angle of the observation direction must be equal to the angle of the incident radiation; this is realized by additional mirrors in the beam path. A special case of directional reflection is the measurement at 0° in relation to the sample standard (perpendicular incidence on the sample). To realize such a beam path, with identical direction of excitation and detection, a semi-transparent mirror must be used. Microscopes generally use this approach for reflection measurements. Sample surfaces should be very smooth or reflective for directional reflection. The wavelength-dependent reflection of the sample is measured, which is determined by the refractive index and absorption coefficient. In addition, the penetration depth is also dependent on the wavelength. In the case of thin layers (usually with low absorption), the interference pattern can also be recorded, which, together with other information about the layer, can be used to determine the layer thickness or the optical functions of the layer. The homogeneity of a coating can thus be checked independently of the knowledge of any coating parameters.
Diffuse reflection is very suitable for characterizing powders and rough surfaces. If there are many scattering centers (i.e. small particles on which the light is scattered), an undirected, diffuse light cone is created. This reflected, diffuse light cone also contains the absorption of the sample. To make this measurable, an integrating sphere is often used. It can be used to determine the total reflection of a sample, as the directional reflection is also recorded. If data on the directional reflection is also available, a sample can be characterized very precisely with regard to its reflection properties. In simpler setups, hemispheres are used for integration or, in the case of hyperspectral imaging measurements, integration cylinders. The integrating sphere and the integrating cylinder must have a rough but highly reflective inner coating, either made of gold, barium sulphate or PTFE. The half-spheres, on the other hand, are constructed in such a way that they capture the diffuse reflection of the sample after coupling in the radiation and focus the beam path towards the detector via directional reflection. The spectra obtained from the diffuse reflection can also be specified as absorption according to the Kubelka-Munk transformation.
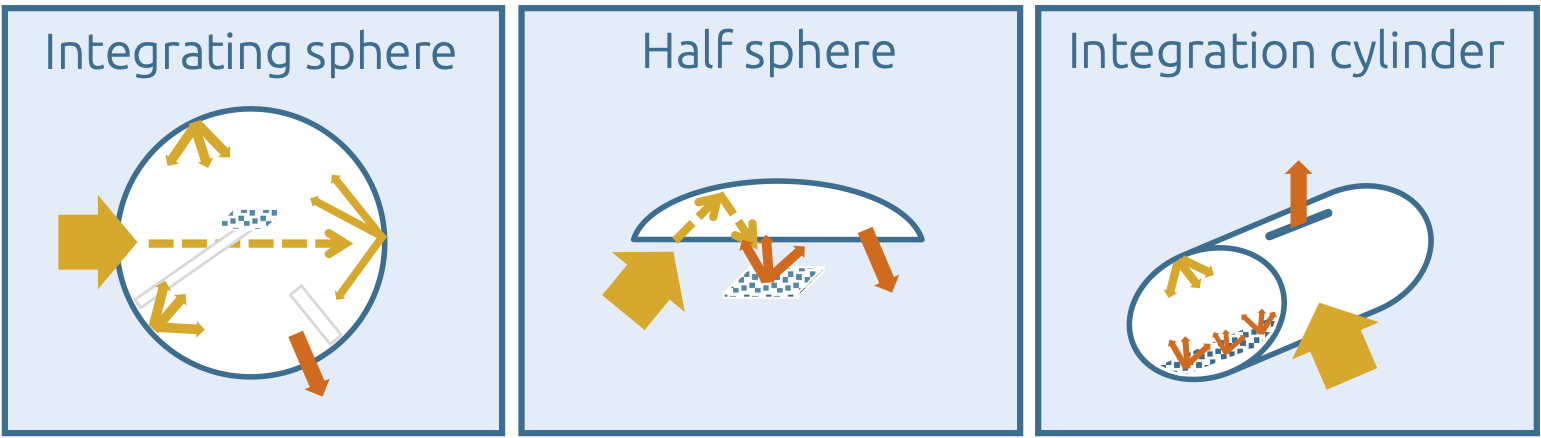
Possibilities for implementing diffuse reflection measurements
Attanuated total reflection
Attenuated total internal reflection is based on the fact that the excitation radiation is guided in a crystal or an optical fiber and is completely reflected at its edges. The angle of incidence (in relation to the normal) must be very large, and total internal reflection only occurs if the difference between the refractive indices of the guiding medium and the cladding or surrounding matter is large enough (otherwise the radiation is coupled out). ATR spectroscopy is widely used in IR spectroscopy. A distinction is also made between single-reflection ATR and multi-reflection ATR. At the positions where the ATR crystal or fiber openly meets the sample, a so-called 'evanescent field' is formed and the excitation radiation interacts with the sample.9 The advantages of ATR spectroscopy are the very high surface sensitivity and the small sample quantities required for the investigation (at least this applies to single-reflection ATR). However, ATR techniques play a subordinate role in hyper- and multispectral imaging.
References
9 For a complete description, please refer to further literature, i. e. M. Otto, „Analytische Chemie“, Wiley-VCH, 4. Auflage 2011, ISBN 9783527328819
Methods in optical spectroscopy
UV-VIS Spectroscopy
For UV-VIS spectroscopy, a wide range of possible combinations of excitation source, optics, measuring geometry and sample chamber as well as detectors are available, which can be specifically selected depending on requirements. If, for example, color values are to be determined in a defined manner, a calibrated excitation source is required. If the aim is to observe the coating thickness using interference evaluation, a goniometer may be required to set the angle of incidence and reflection of the radiation.
A special case is the mobile use of (hyperspectral) UV-VIS spectrometers, where no additional excitation is required and daylight or sunlight is used for excitation instead. In order to obtain comparable spectra, defined referencing, adjustment of the exposure times (especially in changing light conditions) and standardization of the spectra are necessary.
Optical fluorescence spectroscopy
When investigating optical fluorescence, the excitation radiation must be suppressed. In practice, this is achieved by a (detector) observation angle of 0° to the direction of the excitation radiation. Excitation takes place in the UV, blue or green spectral range with intense excitation sources - in addition to discharge lamps (e.g. xenon), lasers are also suitable for excitation. The advantages of discharge lamps are continuous emission, making it easier to change the excitation wavelength. In fluorescence spectrometers, a monochromator is usually used, which is placed in front of the sample.
Infrared (IR) spectroscopy
The instrumentation for IR spectroscopy differs significantly between the near, mid and far infrared. While lenses, optics and detectors from UV-VIS spectroscopy can still be used up to a wavelength of approx. 1000 nm, observation in the near, mid and far infrared requires the aforementioned special detectors based on InGaAs or MCT. Some of the latter also have to be cooled with liquid nitrogen. From the mid-infrared from 2500 nm, the use of special optical materials such as potassium bromide (KBr), zinc selenide (ZnSe), germanium (Ge) or silicon (Si) is mandatory, as only selected materials are permeable in this spectral range. Halogen lamps can be used for excitation up to 2500 nm, as they emit a significant proportion of the emission in the near infrared as thermal radiation. From the mid-infrared, red-hot SiC ceramics ('Globar'), for example, are used as an emission source. In general, the heat input of the IR sources must also be taken into account for sensitive samples.
Hyperspectral spectrometers are generally equipped with transmission or reflection gratings as dispersive elements; single-channel spectrometers are often designed as FT devices with interferometers.
RAMAN spectroscopy
The advantage of many RAMAN spectroscopy configurations is that information about molecular vibrations can be obtained using the simpler and cheaper technique of the visible spectral range (however, if the excitation takes place in the near infrared, corresponding detectors must also be used in RAMAN spectroscopy). In addition, RAMAN spectroscopy is insensitive to water or aqueous media compared to IR spectroscopy. However, the observed spectrum depends very much on the wavelength and intensity of the excitation radiation.

(ν frequency of the excitation radiation, I0 intensity of the excitation radiation, N number of scattering molecules, ∂α/∂q polarizability change)
For this reason, only lasers are used for excitation; common laser wavelengths are 514.5 nm (argon ions or diode) and 785 nm (NIR diode), but practically all available laser wavelengths are possible. The excitation radiation must be masked for the detector, as it is orders of magnitude more intense than RAMAN scattering. So-called notch filters or Bragg gratings are used for this, but hard-coated long-pass filters are more robust and durable. However, the latter do not allow the observation of anti-Stokes bands10, although their observation can often be dispensed with. When using the filters, a high quality (OD value) must be ensured. With inexpensive long-pass color filters, it may also be necessary to use several filters.
A competing process to RAMAN scattering is fluorescence. Due to the intense excitation of the laser, it often occurs in RAMAN spectra and prevents the observation of the RAMAN bands by superposition. The simultaneous fluorescence excitation can be avoided by changing the excitation wavelength (excitation at longer wavelengths, but the RAMAN bands can then also be significantly lower, see equation above) or by observing the anti-Stokes bands in the RAMAN spectrum.
References
10 Anti-Stokes scattering occurs when molecules are already in an excited state and this energy is added to the excitation radiation during re-emission - i.e. re-emission occurs at a higher energy/higher frequency. However, the intensity of the scattering is again 90 % lower than that of Stokes scattering.
Process spectroscopy
Process spectroscopy has been firmly established in the industrial environment for many decades. The resulting spectral data is subject to automated evaluation procedures/methods. These automated methods monitor the process, the medium or the product. They control the spectrometer, record the spectra, evaluate the spectra and provide the operator or process monitor with feedback on the status. For process spectroscopy, it is essential to know the samples, possible interferences and the definition of process limits within which the measured values/measured parameters may be located. Multivariate statistical methods (chemometrics, machine learning algortihms) are used to reliably and quickly provide the desired data or parameters from the recorded spectra.
The evaluation procedures and methods must be validated for the respective process in order to ensure a reliable result.11 Spectral data from process spectroscopy is pre-processed according to the requirements of the result (referencing, smoothing, baseline correction, normalization, etc.). Process parameters can then be determined using chemometric methods. The originally measured raw data is often not retained in process spectroscopy due to its scope, but only the result is documented or saved.
References
11 For validated measurement methods, proof must be provided that they work reliably under defined conditions and that the measurement results can be obtained repeatedly. Characteristics such as precision, accuracy, detection limit, limit of quantification, selectivity, specificity, value range, linearity and robustness must also be defined for the measurement results.
Imaging spectroscopy
Imaging spectroscopy is an umbrella term for all techniques and possibilities for recording spectra that produce an image of a sample or measurement surface. It is a powerful tool for visualizing the relationships between the observed process and the properties of the sample in the surface or in its entirety, in addition to the two-dimensional recording of spectra. This can be, for example, an arbitrarily selected quality characteristic or a quality class or a parameter for the subsequent processing or effect of the sample. In some cases, the 'image' is visually processed for the human eye, especially in IR and RAMAN spectroscopy due to the spectral range used or the low intensities. The use of the term 'imaging spectroscopy' is not uniform. It is always necessary to question which of the following techniques is actually used.
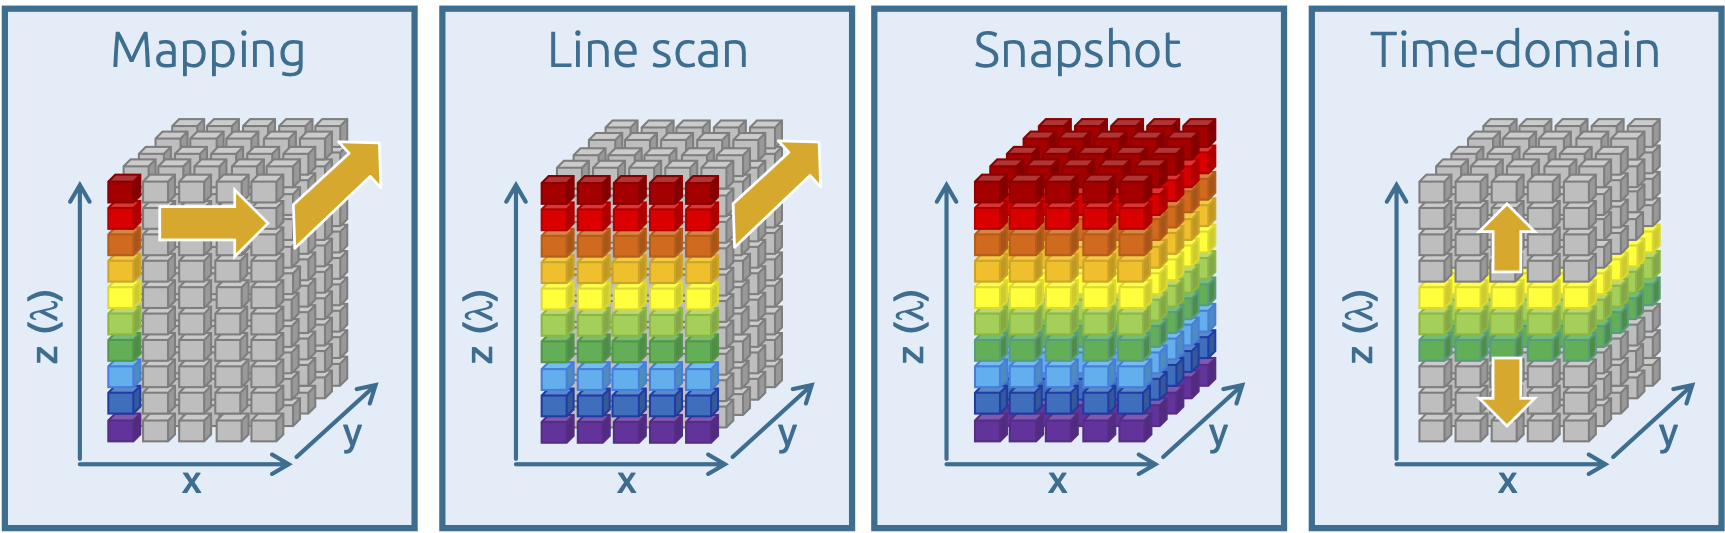
Options for recording a spectroscopic image
In mapping (also known as 'whiskbroom imaging'), a spectral image is built up point by point, i.e. a complete spectrum is recorded with each individual measurement and then either the spectrometer optics or the sample is moved accordingly. Such a procedure is time-consuming, but often offers the highest spectral resolution. In pushbroom imaging, a typical method of hyperspectral imaging, an entire line is spectrally recorded for each individual measurement and the image is constructed by merging the lines. Due to the dispersive structure of such spectrometers, the spectral resolution is often lower (approx. 1-2 nm) than with mapping methods. On the other hand, current detectors can be read out at several hundred Hertz, so that such imaging is also suitable for process spectroscopy. The so-called 'snapshot' method records all wavelengths at all points of the image simultaneously. The detectors used for this usually only allow multispectral imaging. Finally, the 'time-domain' method should be mentioned, in which one or more wavelengths are imaged on the detector for the entire image and a scan is made across the wavelengths. Similar to mapping, there is also a time delay here; the sample or examination area must not change or move during this period.