1 - Fundamentals
- Introduction
- Interaction of light and matter
- Optical Spectroscopy
- The spectrum
- Theory of electron and vibrational excitation
Introduction
One of the founding fathers of spectroscopy is Issac Newton, who observed the color series using a prism and sunlight1 - he called this color series 'spectrum' (Latin for 'appearance'). Many well-known researchers continued these observations over the decades and laid the foundations for today's knowledge, including Frederick William Herschel, Thomas Johann Seebeck, Joseph von Fraunhofer, Robert Kirchhoff and Robert Wilhelm Bunsen. It was only much later, at the end of the 19th century, that the term spectroscopy was coined, using the Greek root 'skopein' for 'to look' alongside 'spectrum'. Likewise, the observations later became calculable through physics.
In general, spectroscopy describes the interaction of any electromagnetic radiation with (again, any type of) matter, with the purpose of investigating this matter. The intensity distribution of the resulting radiation as a function of wavelength, frequency or energy is called a 'spectrum'. The following both relationships are elementary for spectroscopy:


(c speed of light, ν frequency, λ wavelength, h Planck's quantum of action and E energy)
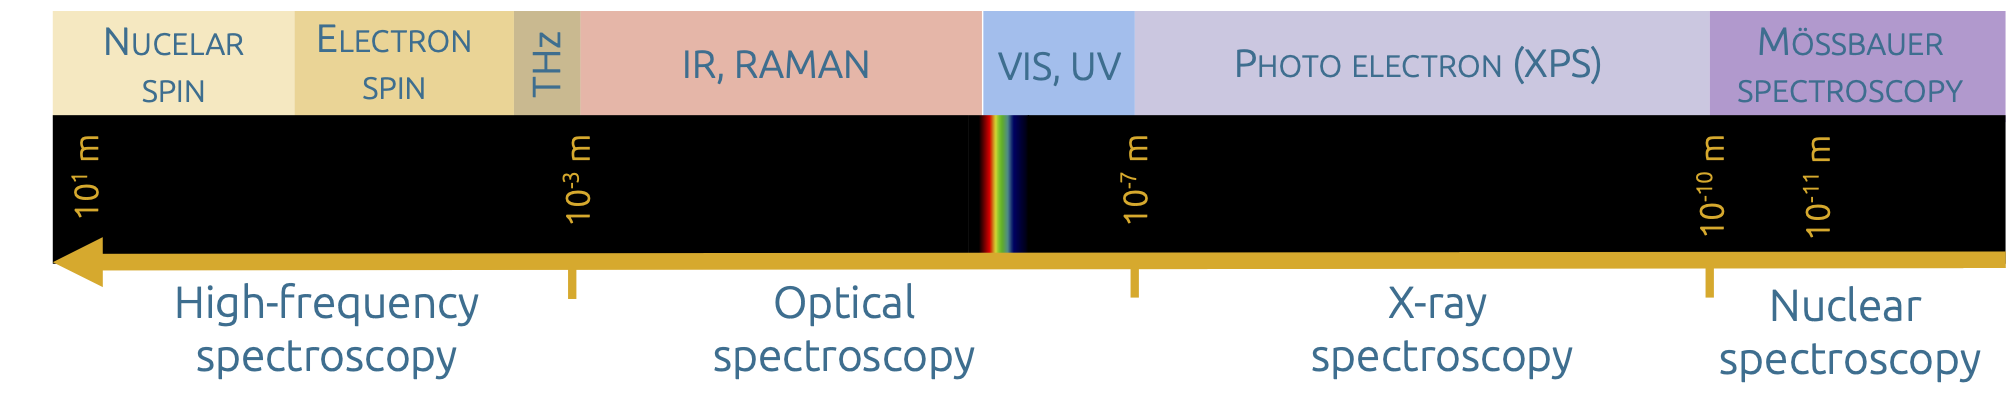
Overview of the electromagnetic spectral range and the associated spectroscopic methods
Spectroscopy is just as diverse as electromagnetic radiation. Spectroscopic methods provide information about the qualitative and quantitative composition of the matter studied. The signature of the electromagnetic radiation after interaction with the matter is specific to the type of matter and may also provide a correlation to the concentration. One of the basic relationships is described by the so-called 'Lambert-Beer's law':

(Eλ extinction or absorbance at the wavelength λ, I0 intensity of the irradiated electromagnetic radiation at the wavelength λ, I1 resulting intensity of the electromagnetic radiation at the wavelength λ, ελ extinction coefficient or spectral absorption coefficient at the wavelength λ, c concentration, d layer thickness)
However, spectroscopic methods per se do not provide any information about sample sizes, structure widths or other spatial scales.
References:
[1] A. A. Mills, „Newton's prisms and his experiments on the spectrum“, The royal society journal of the history of science, 1981, 36(1), https://doi.org/10.1098/rsnr.1981.0002
Interaction of light and matter
Matter can reflect or absorb electromagnetic radiation or the radiation can pass through the matter with little or no interaction. In the latter case, this is referred to as transmission.
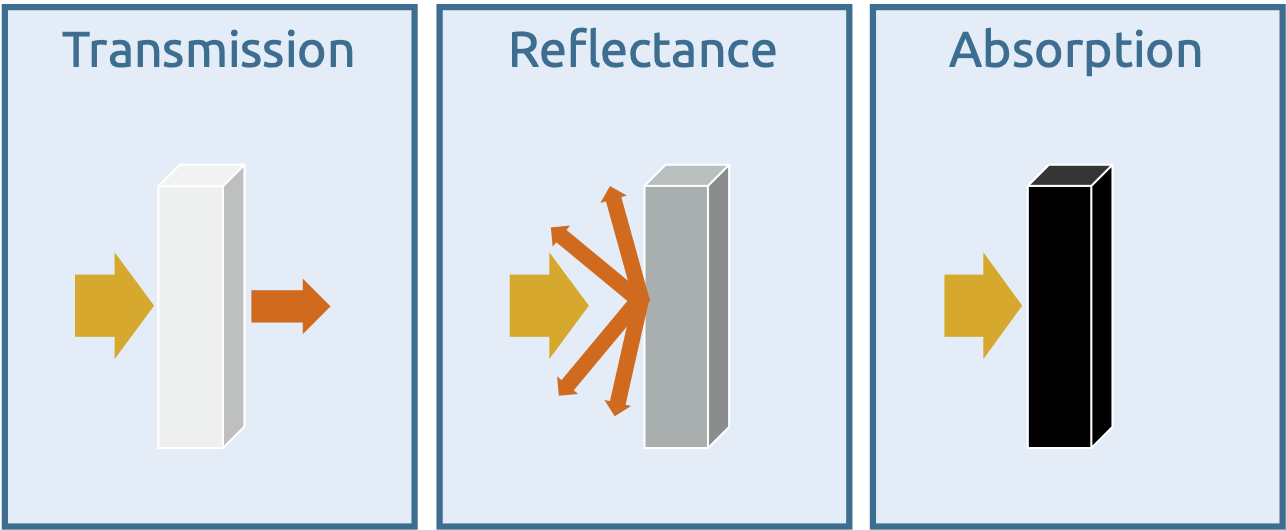
The three basic principles of the interaction of light and matter
If matter completely absorbs the radiation, optical spectroscopy (UV, VIS, IR) is not possible. All radiation energy then remains in the matter and is re-emitted in other areas of electromagnetic radiation. Such bodies are also known as 'black bodies', an illustrative example being black surfaces in VIS spectroscopy.
Special cases are fluorescence spectroscopy and RAMAN spectroscopy, both of which actively utilize the absorption of the excitation radiation and measure the (re-)emission of the slightly wavelength-shifted radiation. However, the mechanisms behind this are completely different in each case.2
Depending on the spectral range, the electromagnetic radiation interacts very differently with the particles under investigation. As the generic terms 'electron excitation spectroscopy' and 'vibrational spectroscopy' suggest, in one case the outer electrons are excited (UV, VIS, fluo) and in the other case the intermolecular vibrations between the atoms (IR, RAMAN).
References:
2 In fluorescence spectroscopy, the change in wavelength is caused by radiationless relaxation of the excited electrons, whereas in RAMAN spectroscopy the change in wavelength is caused by inelastic scattering of the radiation on the atoms, with excitation of molecular vibrations.
Optical Spectroscopy
Optical spectroscopy' refers to vibrational spectroscopy and electron excitation spectroscopy. They can be performed using typical optical components such as mirrors, lenses, gratings and prisms. Optical spectroscopy includes the techniques of:
- Infrared spectroscopy (IR)
- RAMAN spectroscopy (RAMAN)
- Spectroscopy in the visible and ultraviolet spectral range (UV, VIS)
- Optical fluorescence spectroscopy (Fluo)
Vibrational spectroscopy includes the techniques of IR and RAMAN spectroscopy, while electron excitation spectroscopy includes UV-VIS and fluorescence spectroscopy.
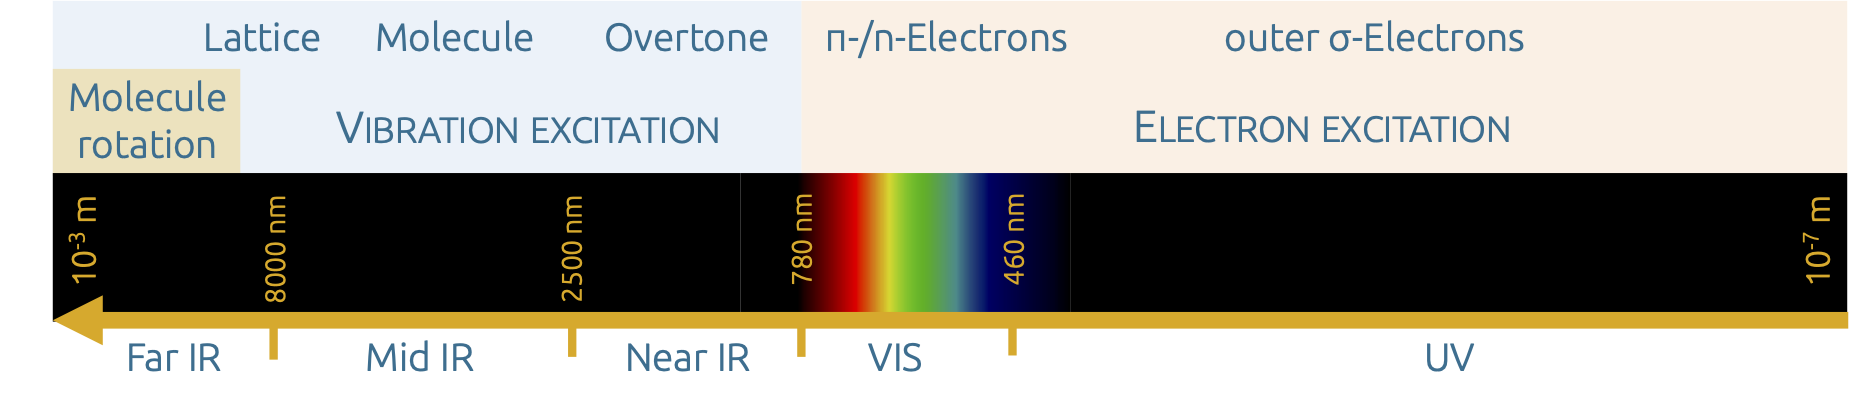
Overview of the spectral range of optical spectroscopy, its classification and types of excitation
The type of spectroscopy in which matter is externally excited by electromagnetic radiation in the measured spectral range is called absorption spectroscopy. If external excitation by electromagnetic radiation can be completely omitted, this is referred to as emission spectroscopy. An example of this is the emission measurement of LEDs, whose emission spectrum is generated by electrical excitation.
The spectrum
All methods of optical spectroscopy have in common that absorption and emission are based on the quantum physical nature of light, i.e. the spectra obtained show discrete energy levels of electronic excitation or vibrational excitation. All observed energy levels depend on the type of atoms involved, on the type of bonds between them and the surrounding neighboring atoms. Therefore, the structure or composition can be deduced from the energies that are absorbed from radiation or emitted as radiation.3
In the spectrum, these energies or energy levels can be found as 'bands'4. Contrary to what is expected with discrete energy levels, the bands are generally not depicted as a 'sharp' line, but are broadened into a band due to thermal excitation (homogeneous broadening). As a measure for the intensity of a band or for the quantization, the integral band area is used instead of the amplitude in the spectrum. The full-width at half maximum (FWHM) υ1/2 is also used to characterize the bands.
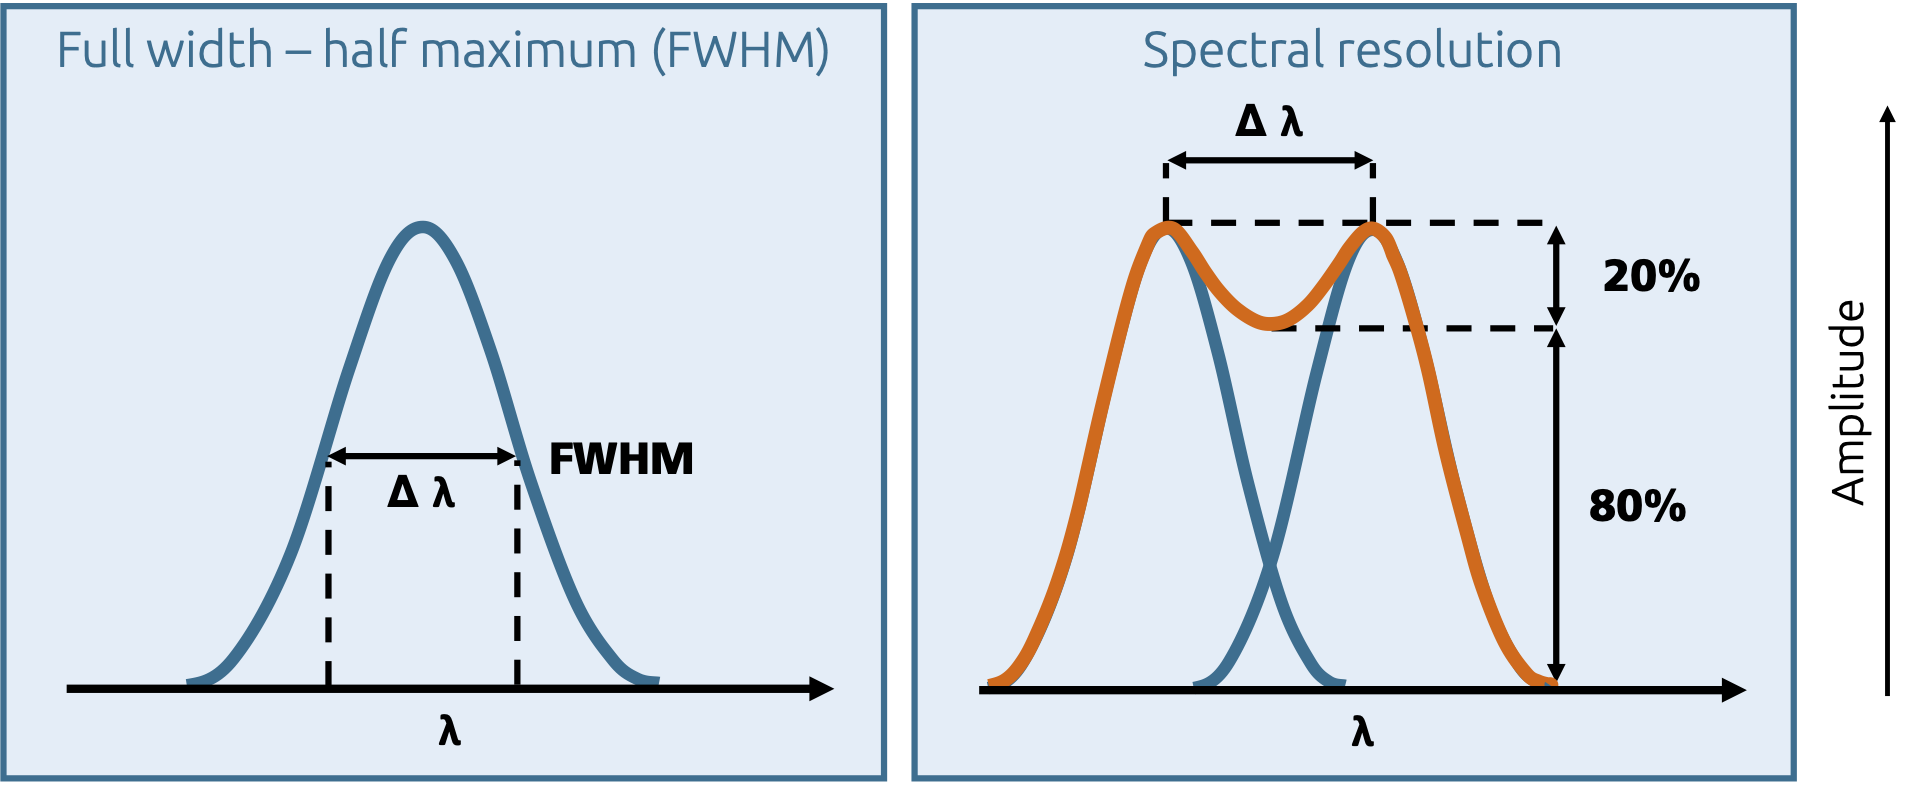
Full width, half maximum (FWHM) and spectral resolution of bands
Bands can also form in the spectrum if individual absorptions cannot be separated due to a lack of resolution in the spectrometer (inhomogeneous broadening). In addition, individual absorptions can also overlap in the spectrum and form a band, but then mathematical methods can be used to separate the bands in order to still obtain a quantitative statement. This can often be recognized by so-called 'shoulders' (step-shaped sections) in such integral bands. In the spectrum, two bands are considered resolved if the intensity between their maxima falls to 80 % or less.
References:
3 W. E. Steger, „Strukturanalytik“, Dt. Verlag für Grundstoffindustrie, 1. Auflage 1992, ISBN 3-342-00044-9
4 The word 'band' is an artificial word and originally referred to non-resolvable rotational absorption in gas spectra.
Theory of electron and vibrational excitation
UV and VIS spectroscopy is based on the excitation of electrons in the outer electron shell (orbital) of an atom or molecule. The energy input of the excitation radiation transfers electrons from the highest occupied orbital - the ground state - to the lowest unoccupied orbital - the excited state. The energy required for this transition is obtained by absorption from the excitation radiation. Theoretically, the absorption of organic molecules can be well described by the so-called HOMO-LUMO concept (HOMO, highest occupied molecular orbital; LUMO, lowest unoccupied molecular orbital), while the absorption of elements (especially for the frequently colored compounds of groups 3-12 in the periodic table) is well described by the ligand field theory. Further absorption in the UV-VIS occurs in compounds due to free electron pairs or multiple bonds, among other things. In general, the more extended an electron system is, the less energy is required for electron excitation and the stronger the absorption is shifted to longer wavelengths (i.e. into visible light). These 'color-giving units' of the molecules are traditionally referred to as 'chromophores'. The electron transitions also follow certain selection rules, so that not all theoretically possible electronic transitions can actually be observed in every case (there are symmetry-prohibited transitions as well as spin-prohibited transitions).
Optical fluorescence spectroscopy is also based on the observation of electronic transitions, but during relaxation (transition of electrons from the excited state to the ground state), after absorption. Compared to directly observable absorption, the quantum yield of fluorescence is low. This is due to the fact that some of the electrons are excited to vibrate during absorption in addition to being excited to a higher orbital (vibronic excitation). However, this process only takes place for a small proportion of the excited electrons. As a result, these excited vibrations relax without radiation and the remaining amount of energy is emitted as fluorescent radiation at longer wavelengths when they return to the ground state.5 However, as the intensity of the fluorescence is directly proportional to the excitation radiation, the most intense radiation possible is used for excitation.
In IR spectroscopy, absorption of the sample is also observed based on the excitation radiation. However, the energy of the radiation excites vibrations between the atoms in the molecule or a solid lattice. From a theoretical point of view, the vibrational frequencies of the molecules can be described approximately using the spring force model as a harmonic oscillator. If the considerations are continued on the basis of wave mechanics and only the accessible, discrete energy levels are taken into account, the equation is obtained for diatomic molecules:

(E energy, h Planck's quantum of action, f force constant, μ reduced mass, ν oscillation quantum number)
In reality, the molecules do not behave completely harmonically (if the oscillation amplitudes are too large, the molecules would dissociate or break up the lattice), so that overtone oscillations do not occur entirely at twice the energy in the spectrum, contrary to the above equation. In multi-atomic molecules, the vibrations of the individual atoms are coupled and the theoretical description of the oscillations becomes much more complicated. However, the number of oscillations in a molecule can be determined very precisely using the following equation:6

(Z number of vibrations, n number of atoms in the molecule; for linear molecules: Z = 3n - 5)
The types of vibrations are described using Greek letters and are fundamentally divided into valence vibrations (also known as stretching vibrations, νs symmetrical, νas antisymmetrical) and deformation vibrations (δ and γ bending vibrations, τ twisting-S., ρ rocking-S., ω wagging-S.). In IR spectroscopy, only those vibrations that lead to a change in the dipole moment of a molecule can be observed. Accordingly, the vibrations are divided into IR-active and IR-inactive. For IR spectroscopy, too, there are clearly more detailed considerations on the symmetry of the molecules or lattices as well as selection rules; here too, reference should be made to the literature already mentioned.
Complementary to IR spectroscopy is RAMAN spectroscopy, i.e. IR-inactive vibrations can be observed in RAMAN. In contrast to IR spectroscopy, those vibrations that lead to a change in the polarizability of the molecule are RAMAN-allowed. In this technique, also known as RAMAN scattering, a molecule is excited by monochromatic light in the visible or near-infrared spectral range. The energy introduced by the exciting radiation is usually re-emitted (by electron oscillations) while maintaining the frequency; this elastic scattering is called Rayleigh scattering. If the electron oscillations induced by the excitation lead to a change in the polarizability of the entire molecule, a small part of the energy introduced is used to excite the molecular oscillation and the inelastically scattered (Stokes scattering), frequency-reduced radiation is re-emitted. The scattering is diffuse in all spatial directions. The highest RAMAN intensities are observed in vibrations in which the entire molecule is contracted or stretched. An illustrative example is the symmetrical stretching vibration of CO2.
References:
5 For a complete description of the relaxation processes of fluorescence spectroscopy, please refer to further literature. I. e. M. Otto, „Analytische Chemie“, Wiley-VCH, 4. Auflage 2011, ISBN 9783527328819
6 A molecule with n atoms has 3n degrees of freedom of movement corresponding to the three spatial directions. Of these, 3 are allotted to translational motion and 3 to rotational motion (for linear molecules, rotation is identical for two spatial directions and only 2 degrees of freedom are deducted), in each case along the spatial axes. The remaining degrees of freedom are accounted for by the vibrational oscillation.